Gene set analysis

Keegan Korthauer (with slides contributions from Yongjin Park and Paul Pavlidis)

February 27, 2024

Reminders

  • Analysis Assignment due Thursday

  • Optional midcourse feedback (bonus point) due Friday

Today’s lecture

  • Motivations: What’s next after genomics analysis?
    • What have we learned?
    • How do we know that our discovery is meaningful?
  • What is Gene set analysis?
    • Set-based approach: hypergeometric test
    • Rank-based approach GSEA by KS statistic

Biological mechanisms / processes are modular

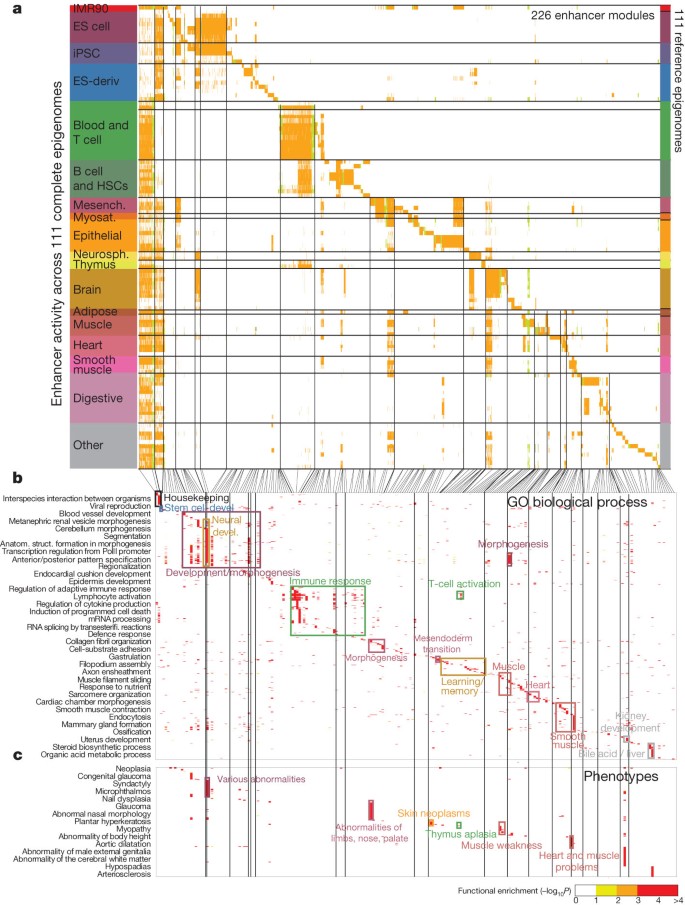
Roadmap epigenomics, Nature 2015


Epigenomic (enhancer element) modules across 111 human tissues


Gene Ontology information confirms cell-type or tissue-specific biological pathways

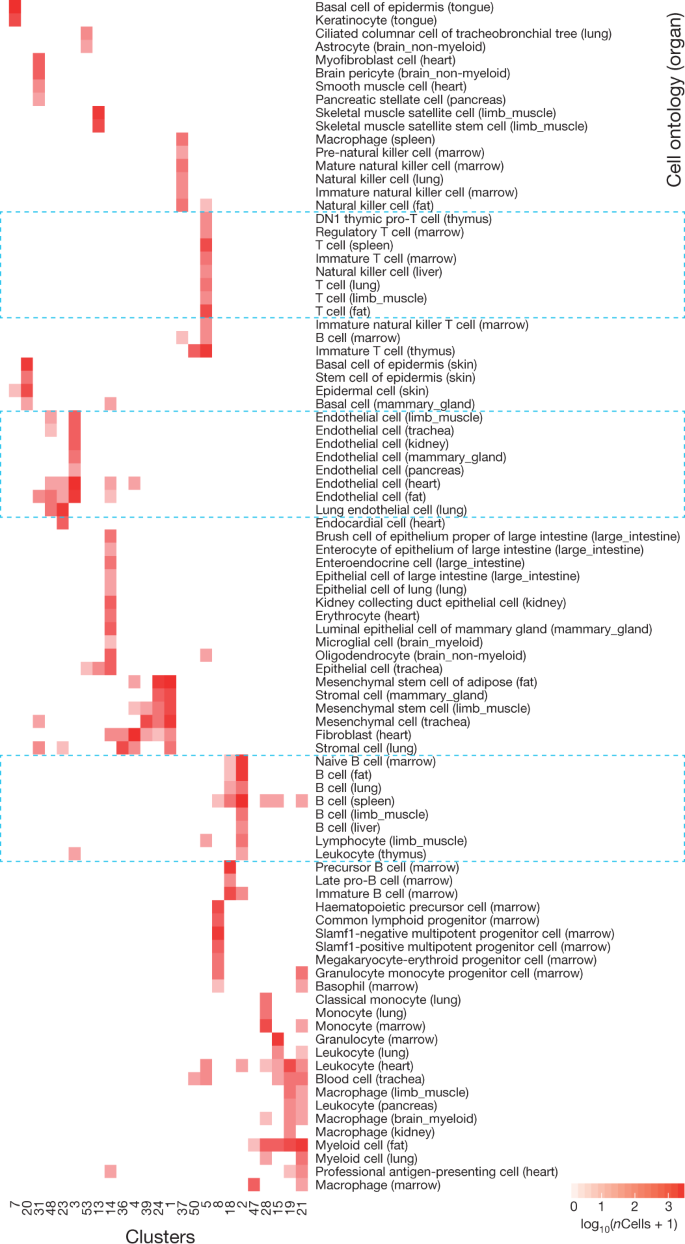
Clusters of cells correspond to ‘cell types’

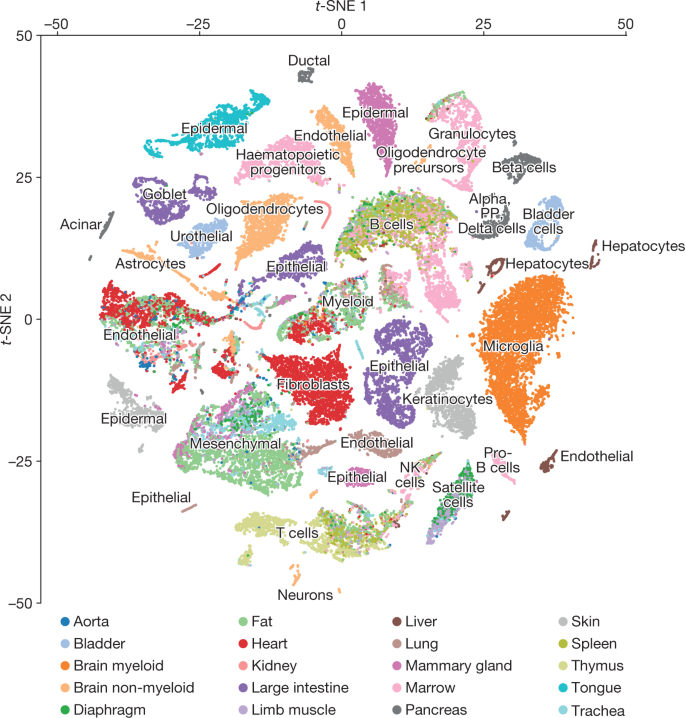
Tabula Muris, Nature 2018: “Comparison of cell-type determination as performed by unbiased whole-transcriptome comparison versus manual annotation of clusters by organ-specific experts.”

Enrichment analysis to confirm previous knowledge

Ishizuka et al., Nature 2019

What is Gene Set Analysis?

(Discrete) Gene Set Analysis

Input:

  1. A dictionary of gene sets that map genes to sets (gene-to-set mapping)

  2. A list of top genes identified in our own study (after FDR control)

(Rank-based) Gene Set Enrichment

Input:

  1. A dictionary of gene sets that map genes to sets

  2. A full list of gene-level scores (e.g., p-values)

Output: A table of scores for all the gene sets in the ‘dictionary’

Where does the ‘dictionary’ come from?

  • Gene Ontology (GO) is a controlled vocabulary for function

  • Began ~25 years ago; over 45K terms today

  • Mostly species-agnostic

  • Three aspects:

    1. Biological Process
    2. Cellular Component
    3. Molecular Function

gotrack.msl.ubc

GO structure

  • Structure is an acyclic graph, not a tree: terms commonly have multiple parents
  • Annotations in the database don’t separately list out all the parents
  • Includes a mix of ‘directly annotated’ and many ‘inferred’ terms
  • Several relationship types

GO aspects

Molectular Function (MF)

  • “Elemental activities, such as catalysis or binding, describing the actions of a gene product at the molecular level.”

  • Primarily enzymatic activities

Cellular Component (CC)

  • Part of a cell/extracellular environment of which a gene product is a component

  • Examples: “cell wall”, “actin body”

Biological Process (BP)

  • “A phenomenon marked by changes that lead to a particular result, mediated by one or more gene products.”

  • Closest GO concept to “pathways”

Limitations of GO terms

  • Incomplete and unstable (continual updates)

  • Distribution of annotations per gene is non-uniform (many genes have few/none, others have hundreds)

  • Doesn’t give relationship between genes within a term

Pathways: Another grouping of genes

  • Example: Kyoto Encyclopedia of Genes and Genomes (KEGG) Pathways database

  • Species-specific directed networks of genes and their relationships, curated from the literature

  • Pathways are organized into functional categories (not nearly as complex as GO)

What have we learned from our differential expression analysis?

blue: some biological pathway of interest

Let’s drop the edges in biological networks

Prior Knowledge of biological pathways define a set of genes (blue)

Does this pathway overlap with our DEG list?

Suppose we discovered the 8 DEG outlined (pink)

Is our DEG list enriched for genes in this pathway?

Suppose we found \(q\) genes are overlapping with this pathway (green)

Gene Set Analysis testing over-representation of DEGs

What are the relevant numbers?

  • \(N\): # genes in this universe

  • \(m\): # genes in this set

  • \(n\): # genes not in this gene set

  • \(k\): # DEGs in our analysis

  • \(q\): # DEGs (of \(k\)) overlapping with the set of \(m\) genes

Is this overlap of \(q=6\) of \(k=8\) genes significant?

In this example:

  • \(N = 24\) total genes

  • \(m = 9\) genes in this set

  • \(n = N - m = 15\) not in this set

  • \(k = 8\) DEGs

  • \(q=6\) out of \(k=8\) overlap

Is this overlap of \(q=6\) of \(k=8\) genes significant?

Questions:

  • Is it meaningful enough to report?

  • Is it surprising enough that we recapitulated 6/9 (~67 %) genes in the set?

  • Is it surprising enough that we 6/8 (~75 %) of our DEG are in the set?

  • What is the null distribution?

  • What is the generative/simulation scheme?

How do we find \(q\) out of \(k\) DEGs overlapping with a gene set of \(m\) genes?

Under the null of hypergeometric distribution

  1. Randomly sample \(k\) DEGs out of \(N\) genes

  2. Of these \(k\) genes, \(q\) overlap with a gene set consisting of \(m\) genes

  3. The rest \(k-q\) genes overlap with genes outside of the gene set \(N-m\)

How to generalize?

Binomial coefficient: Let’s see if we can estimate the null distribution by counting

  • How many possible ways to select \(k=8\) out of \(N=24\) genes, ignoring the order of \(k\) selected genes and \(N-k\) not selected genes?

  • We can think of this as three steps:

    1. enumerating \(N\) genes
    2. partition them into the first \(k\) genes and the rest
    3. ignore the order within each partition

\[{24 \choose 8} = \frac{{\color{teal}\textsf{\{all possible ways to enumerate }24 \textsf{ genes}\}}} {{\color{magenta}\{ \textsf{enumerating }8 \textsf{ genes}\}} {\color{blue}\{\textsf{enumerating }16 \textsf{ genes} \}}} = \frac{{\color{teal}24!}}{{\color{magenta}8!}{\color{blue}16!}}\]

Calculating the binomial coefficient

There are a lot of ways to select \(k=8\) DEGs out of \(N=24\) total genes!

choose(24,8)
[1] 735471

What is the probability of selecting (at random) this exact set of \(k\) DEGs out of \(N\) genes?

\[{N \choose k}^{-1}\]

1/choose(24,8)
[1] 1.359673e-06

Enumerating the other possibilities

  • How many possible ways of finding \(q\) DEGs overlapping with \(m\) genes in the gene set? \[{m \choose q}\]
  • How many possible ways of finding the rest \(k-q\) DEGs overlapping with (\(N-m=n\)) genes in the gene set? \[{N-m \choose k-q}\]

Probability distribution to describe this process

Hypergeometric distribution

A discrete probability distribution that describes the probability of \(q\) successes (random draws for which the object drawn has a specified feature) in \(k\) draws, without replacement, from a finite population of size \(N\) that contains exactly \(m\) objects with that feature.

image source: en.wikipedia.org/wiki/Hypergeometric_distribution

Hypergeometric distribution

Probability mass function

\[ \begin{eqnarray*} P(x=q|N,m,k) &=& \sum_{\begin{array}{l} {\color{blue} \textsf{# ways to select }q\textsf{ out of }m } \\ {\color{teal} \textsf{# ways to select }(k-q)\textsf{ out of }N-m } \end{array}} {\color{magenta} \begin{array}{l} \textsf{the probability} \\ \textsf{of choosing a set size }k \\ \textsf{out of total }N \end{array}} \\ &=& { \underbrace{\color{blue} {m \choose q}}_{ \begin{array}{l} {\color{blue}\textsf{# ways to choose }} \\ {\color{blue}q\, \textsf{ overlap out of }m} \end{array} } } { \times \underbrace{\color{teal} {N-m \choose k - q}}_{ \begin{array}{l} {\color{teal}\textsf{# ways to choose }} \\ {\color{teal}(k-q) \textsf{ out of }N-m} \end{array} } } { \times {\color{magenta} {N \choose k}^{-1} } } \end{eqnarray*} \]

What is the probability of \(k\) overlapping DEGs?

Hypergeometric PMF

\[P(x=q|N,m,k) = \frac{{m \choose q} {N - m \choose k-q}}{{N \choose k}}\]

Hypergeometric CDF

\[P(x{\le} q|N,m,k) = \sum_{i = 0}^{q} \frac{{m \choose i} {N - m \choose k-i}}{{N \choose k}}\]

Hypergeometric test for testing significant overlap

\[H_{0}:\, x \le q \quad \textsf{vs.} \quad H_{1}:\, x > q\]

We may observe overlap \(q\) genes by random sampling of \(k\) genes without replacement.

Therefore, we can calculate the p-value:

\[P(x > q|n, m, k) = 1 - \sum_{i = 0}^{q} \frac{{m \choose i} {n \choose k-i}}{{n+m \choose k}}\]

1-phyper(q = 6, m = 9, n = 15, k = 8)
[1] 0.0007464604

How significant is \(q\) overlap in our discovery?

\(m=9\), \(n=15\), & \(k=8\):

If \(q=3\):

If \(q=6\):

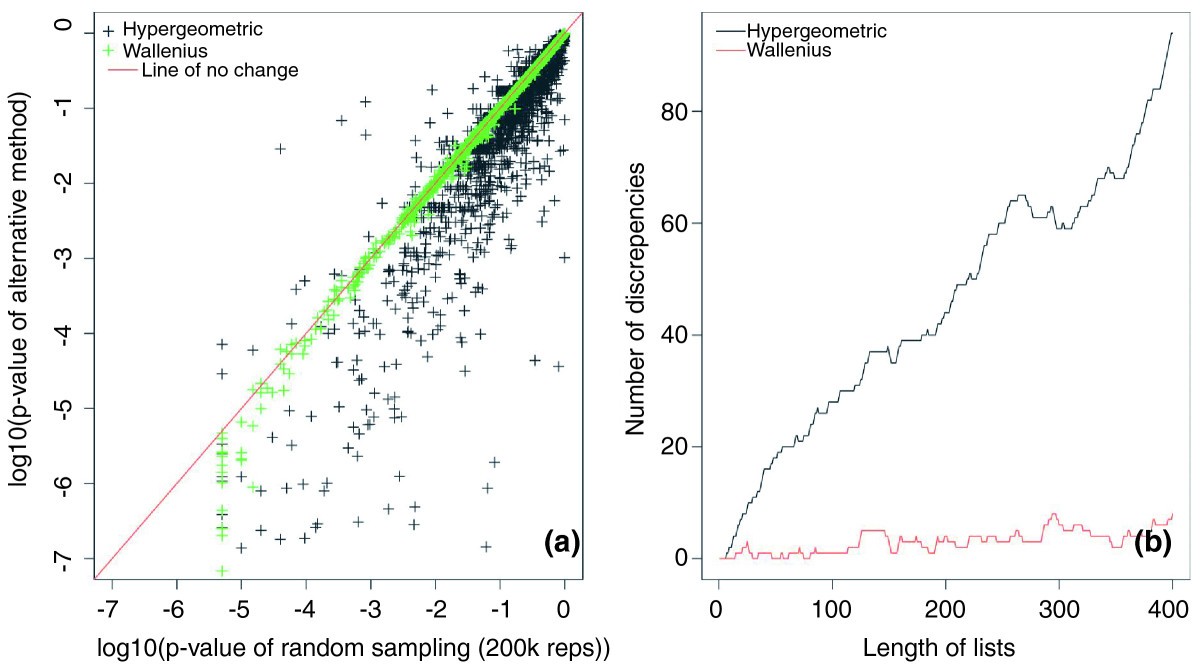
Not all gene sets are the same (gene length bias)

So far, we assumed all genes are independent and equally likely to be DE under the null

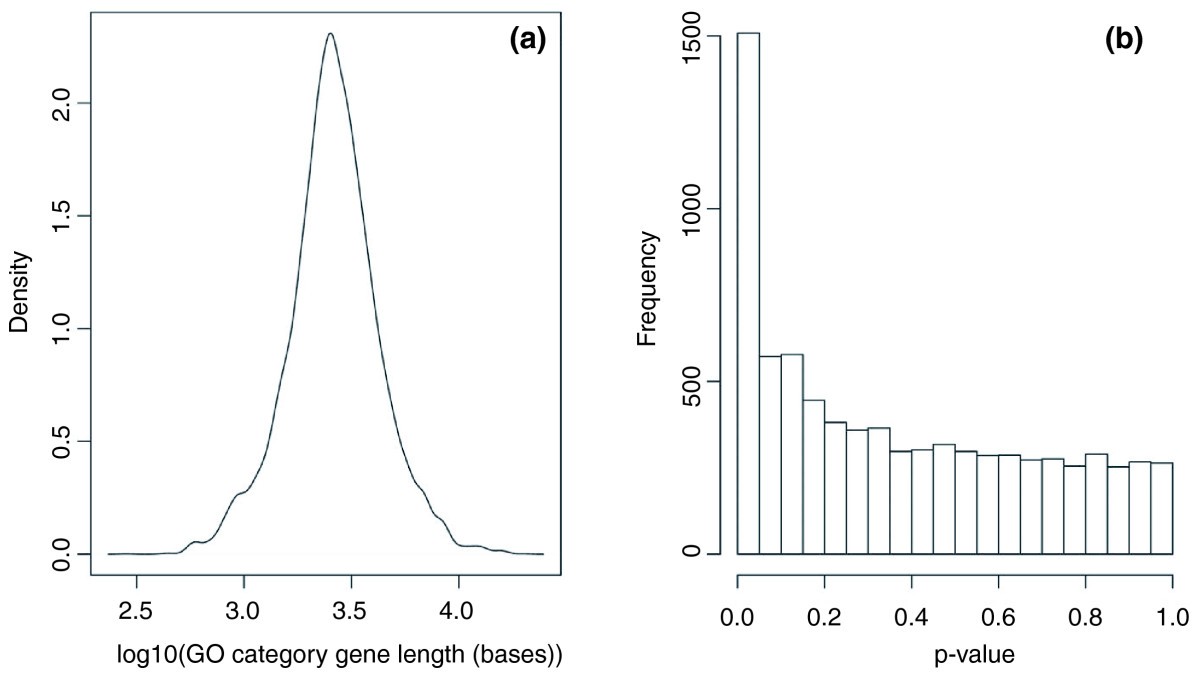
  1. Distribution of average gene lengths in GO categories

  2. Wilcoxon p-values of median length of genes in 7,873 GO categories compared to overall

Longer genes tend to be more differentially expressed

Young et al. 2010, Genome Biology

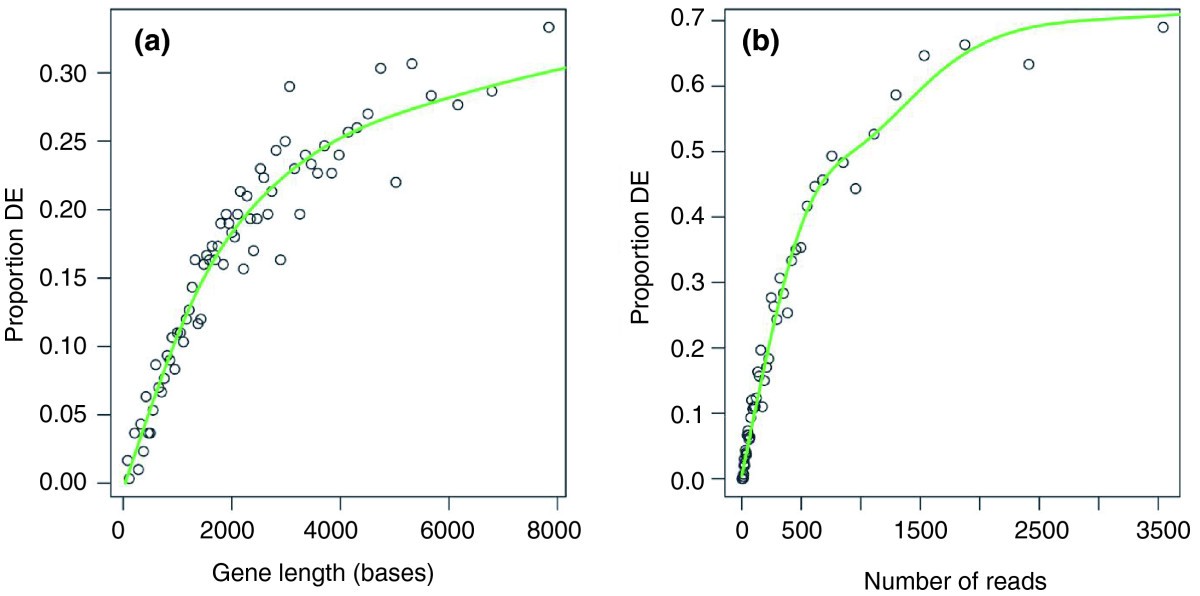
GOseq null distribution conditions on gene lengths

Young et al. 2010, Genome Biology

Summary of discrete gene set analysis

When does it apply?

  • We have a list of genes after accounting for multiple hypothesis testing

  • We want to know whether our list is overrepresented in some gene sets of interest

When does it not apply?

  • Don’t have a good way to select a list of genes:

    • Our discovery data may lack statistical power, i.e., no (or a few) significant genes left after multiple hypothesis correction
  • There is a hidden factor that can affect two steps: (1) gene set selection (annotations/knowledge) and (2) differential expression calling

Note

Estimating the null distribution of ranks/scores over gene sets of interest is nontrivial

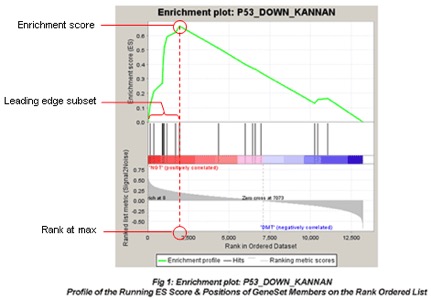
Rank-based Gene Set Enrichment Analysis (GSEA)

Image source: gsea-msigdb.org

Rank-based GSEA (Subramanian et al. 2005)

  • A collection of gene-sets: \(\mathcal{C}_{1}, \ldots, \mathcal{C}_{K}\)

  • A vector of gene-level scores (\(G\) genes): \(z_{1}, \ldots, z_{G}\)

  • Each \(z_{g}\) could come from differential expression analysis

GSEA algorithm

  • For each \(k\)

    • Compute a set-level score \(S_{k}(\mathbf{z},\mathcal{C}_{k})\)

    • E.g., Kolmogorov-Smirnov statistic comparing

\[\{z_{g}:\,g \in \mathcal{C}_{k}\} \, \textsf{vs.} \, \{z_{g}:\,g \notin \mathcal{C}_{k}\}\]

Rank-based GSEA (Subramanian et al. 2005)

  • Construct null distribution of \(S_{1}, \ldots, S_{K}\) by sample label (case-control) or gene-to-set membership permutation

  • Using null distribution by permutation, estimate p-values and false discovery rates

  • If we knew null distribution, we would not need expensive permutations

Good:

  • No cutoff/assumptions needed to estimate null distribution

  • Aggregate scores across many genes! (boost the power)

Bad:

  • Need to define an appropriate statistic?

  • What do we permute? Samples? Gene sets?

  • Permutations are computationally intensive

Fast GSEA (FGSEA)

Korotkevich et al. 2021

Simulation (Efron and Tibshirani 2007)

  1. Generate basal gene expression (sample \(i\), gene \(g\))

\[X_{i,g} \sim \mathcal{N}\!\left(0,1\right)\]

  1. Sample case vs. control membership (the rows of \(X\)) uniformly at random

  2. Sample gene set membership uniformly at random

  3. For the first gene set, select a certain fraction of genes to perturb

  4. For the selected genes \(g^{*}\), add some \(\Delta\) value to \(X_{i,g^*}\) if the sample \(i\) belongs to the control group

Let’s simulate some gene set data (Efron & Tibshirani 2007)

simulate.data <-
    function(G = 1000,        # genes
             K = 150,         # gene sets
             n.samp = 100,    # sample size
             delta = .4,      # perturbation
             p.perturb = 1) { # Pr of petrub
  case.control <- sample(0:1, n.samp, TRUE)
  S <- sample(K, G, TRUE)       # gene sets
  X <- .rnorm(n.samp, G)        # All the other genes
  ## Perturbation of the first gene set
  .genes.1 <- which(S == 1)
  n1 <- length(.genes.1)
  n.perturb <- max(floor(n1 * p.perturb),1)
  .genes.1 <- sample(.genes.1, n.perturb)
  .case <- case.control == 1
  X[.case, .genes.1] <- X[.case, .genes.1] + delta
  require(Matrix)
  .membership <- sparseMatrix(j=1:G, i=S, x=rep(1,G))
  list(X=X, S=.membership, Y=case.control)
}
set.seed(1)
dat <- simulate.data()

str(dat)
List of 3
 $ X: num [1:100, 1:1000] 0.399 -0.262 -0.303 -0.734 -1.382 ...
 $ S:Formal class 'dgCMatrix' [package "Matrix"] with 6 slots
  .. ..@ i       : int [1:1000] 107 47 32 44 148 30 101 144 72 86 ...
  .. ..@ p       : int [1:1001] 0 1 2 3 4 5 6 7 8 9 ...
  .. ..@ Dim     : int [1:2] 150 1000
  .. ..@ Dimnames:List of 2
  .. .. ..$ : NULL
  .. .. ..$ : NULL
  .. ..@ x       : num [1:1000] 1 1 1 1 1 1 1 1 1 1 ...
  .. ..@ factors : list()
 $ Y: int [1:100] 0 1 0 0 1 0 0 0 1 1 ...

We’d like a representative score for genes within each set

What will be a proper gene set score?

Can we simply aggregate gene-level z-scores (or t-statistics) within each set?

Irizarry et al. (2009), using Stouffer Z-score

\[S_{k} = \sum_{g \in \mathcal{C}_{k}} z_{g} / \sqrt{|\mathcal{C}_{k}|} \sim \mathcal{N}\!\left(0, 1\right)\] if \(Z_{g} \sim \mathcal{N}\!\left(0,1\right),\,\forall g\)

Aggregating z-scores within a set

Function to run a t test for each gene:

run.t.test <- function(X, Y){
  .case <- Y == 1
  .ctrl <- Y == 0
  .fun <- function(x){
    t.test(x[.case],
           x[.ctrl])$statistic
  }
  apply(X, 2, .fun)
}

Function to compute Stouffer Z-score

geneset.score <- function(X, S, Y) {
    z.genes <- run.t.test(X, Y)
    n.sets <- apply(S, 1, sum)
    z.sets <- (S %*% z.genes /
               sqrt(n.sets))
}
z.sets <- geneset.score(dat$X, dat$S, dat$Y)     

Constructing the null distribution by gene permutation

What if we don’t know the distribution of set-wise scores?

S.perm <- t(apply(dat$S, 1, sample))
z.perm <- geneset.score(dat$X, S.perm, dat$Y)

How it goes:

  • Repeatedly permuting gene set membership matrix while preserving the number of genes within each set

  • Compute set-level z-scores (or a similar kind) and construct null distribution

  • Calculate p-values by counting the frequency of observed \(S_{k}^{*} > S_{k}^{\textsf{perm}}\)

Constructing the null distribution by sample permutation

Y.perm <- sample(dat$Y)
z.perm <- geneset.score(dat$X, S.perm, Y.perm)

  • Repeat the permutation of case-control labels while preserving the same number of cases and controls

  • Compute set-level z-scores (or a similar kind) and construct null distribution

  • Calculate p-values by counting the frequency of observed \(S_{k}^{*} > S_{k}^{\textsf{perm}}\)

Summary of rank-based gene set analysis

When does it apply?

  • We have ranked all our genes by a score/test statistic (or compute a summary score for every gene set of interest)

  • We want to know whether any of our gene sets of interest tend to have more highly ranked genes (or higher summary scores)

When does it not apply?

  • There is a hidden factor that can affect two steps: (1) gene set selection (annotations/knowledge) and (2) gene scoring

Note

Estimating the null distribution of ranks/scores over gene sets of interest is nontrivial